Automated CSV Reporting Pipeline
This project implements a modular ETL (Extract, Transform, Load) pipeline for automated business intelligence. It processes CSV-based sales records using Pandas, computes high-level KPIs, and generates a suite of Matplotlib visualizations. The system concludes by dynamically assembling a responsive HTML5 dashboard and automating its delivery via an SMTP-based email engine. The architecture follows clean code principles, separating data ingestion, statistical analysis, and reporting logic into a scalable directory structure.
Key Features
- End-to-End ETL Automation: Designed a robust pipeline that automates the transition from raw data ingestion to stakeholder delivery without manual intervention.
- Multi-Dimensional Business Analytics: Engineered a KPI engine to track total revenue, peak-performing products, and regional sales distribution using Pandas aggregation.
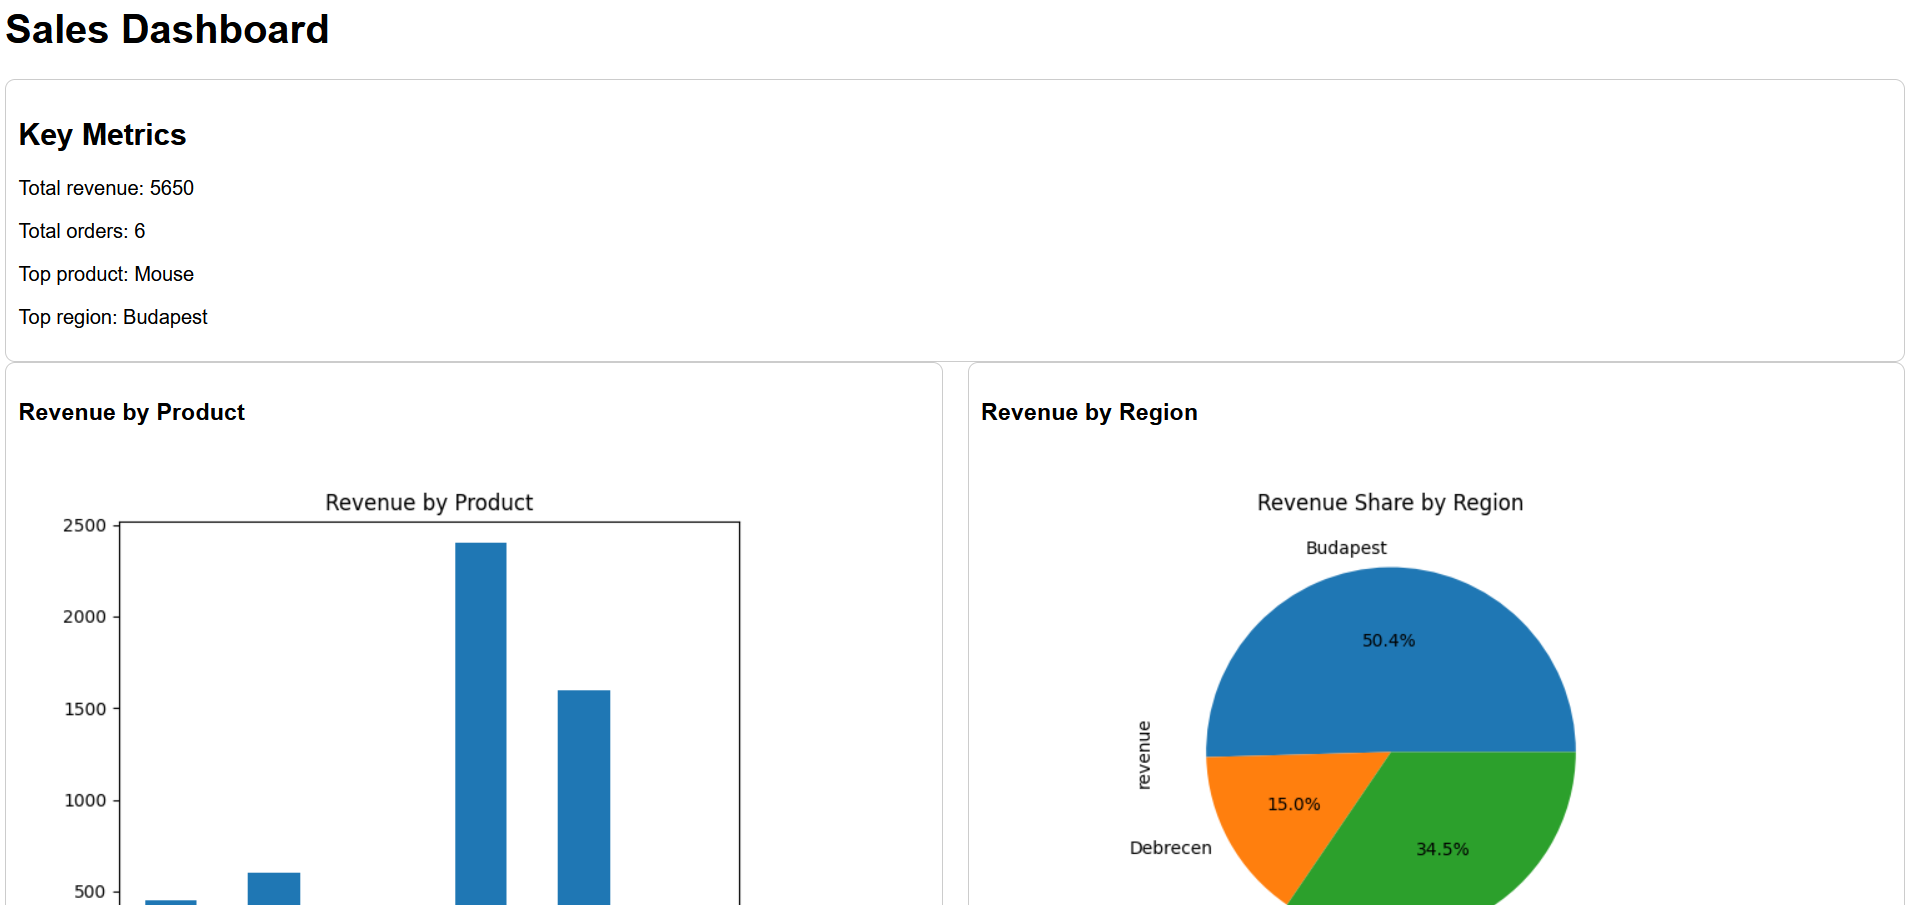
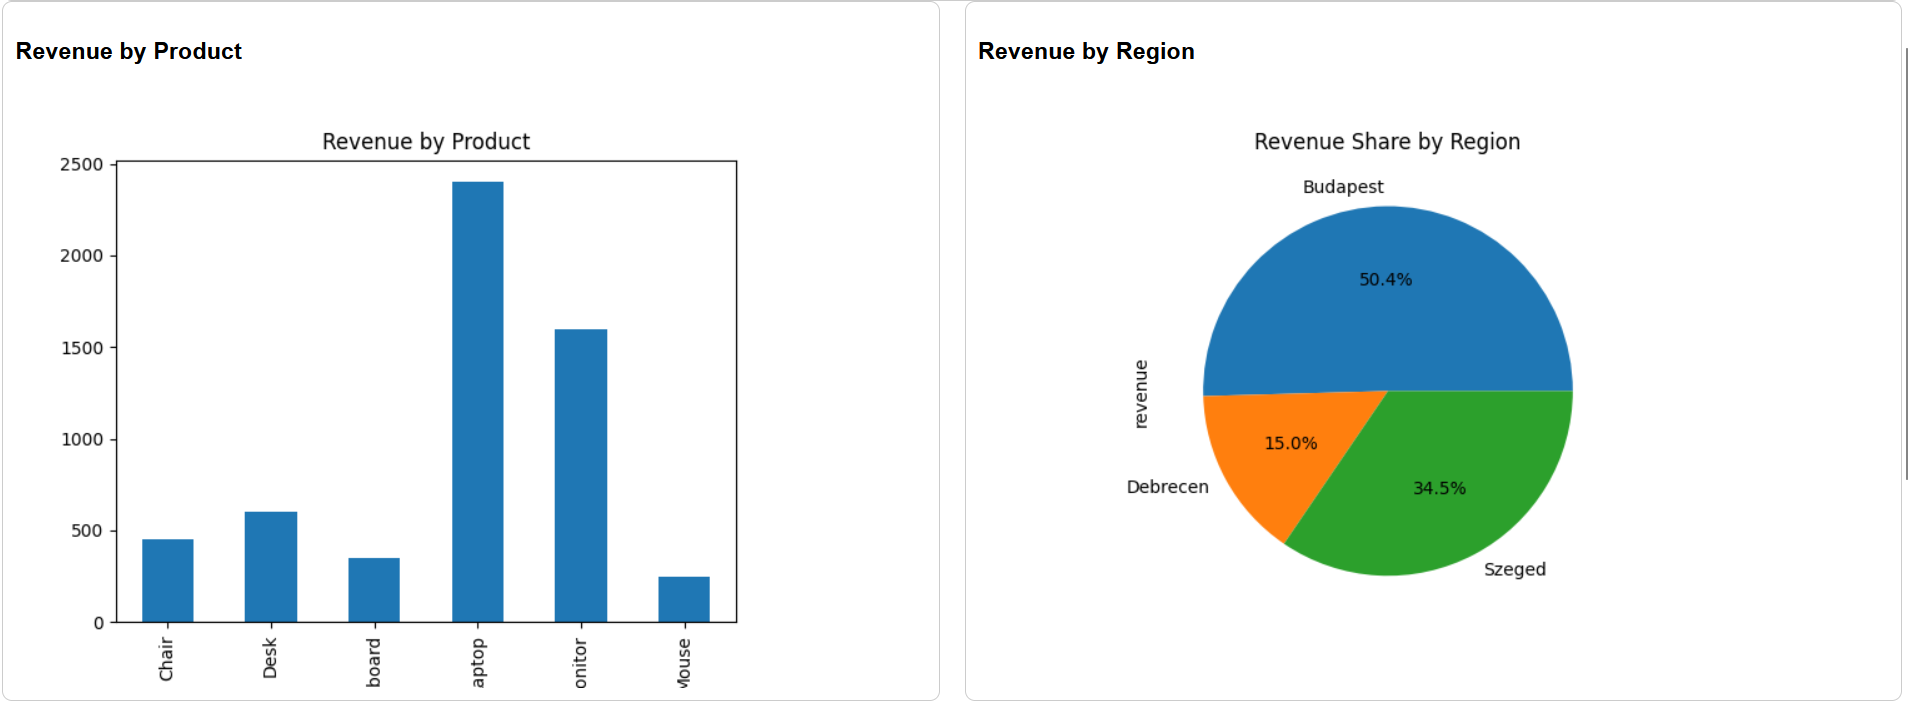
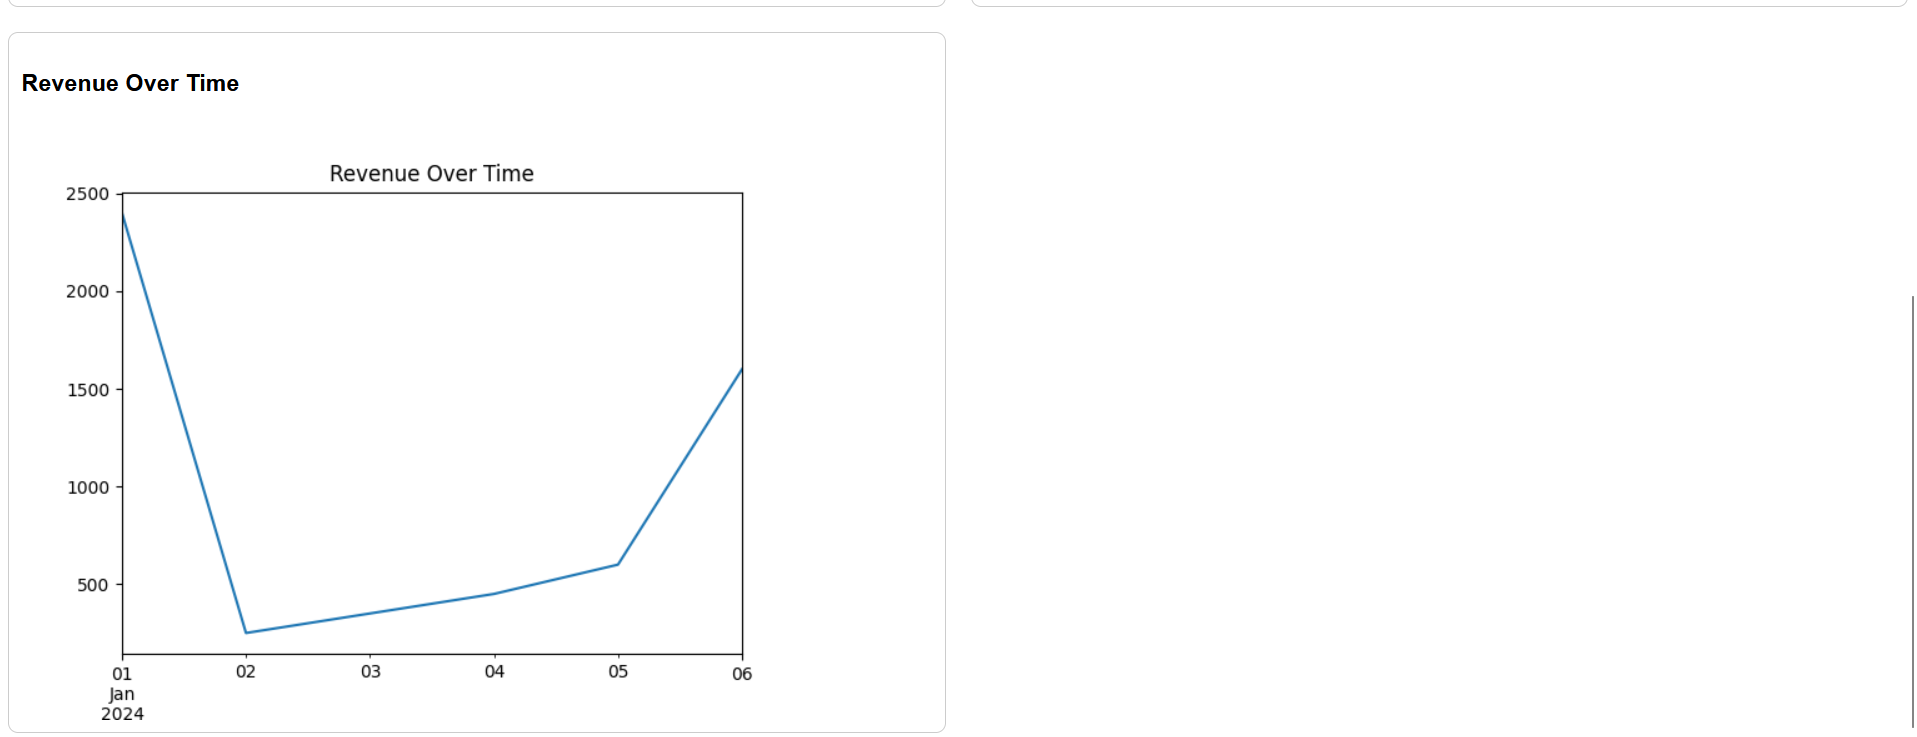
- Dynamic Data Visualization: Integrated a Matplotlib-based charting suite to generate bar charts for product performance, pie charts for regional shares, and time-series plots for trend analysis.
- Automated HTML Reporting: Developed a dynamic report generator that embeds generated assets into a custom-styled, grid-based HTML5 dashboard for executive review.
- SMTP Email Integration: Built a secure automated notification system using the smtplib and email.message libraries, supporting HTML attachments and TLS encryption.
- Modular Software Architecture: Structured the codebase into a production-ready 'src' pattern, ensuring high maintainability and testability of individual pipeline components.
Tech Stack
PythonPandas (Data Manipulation)Matplotlib (Data Visualization)SMTP / Email Library (Automation)HTML5 / CSS3 (Reporting Layout)OS & File I/O (Asset Management)
Screenshots