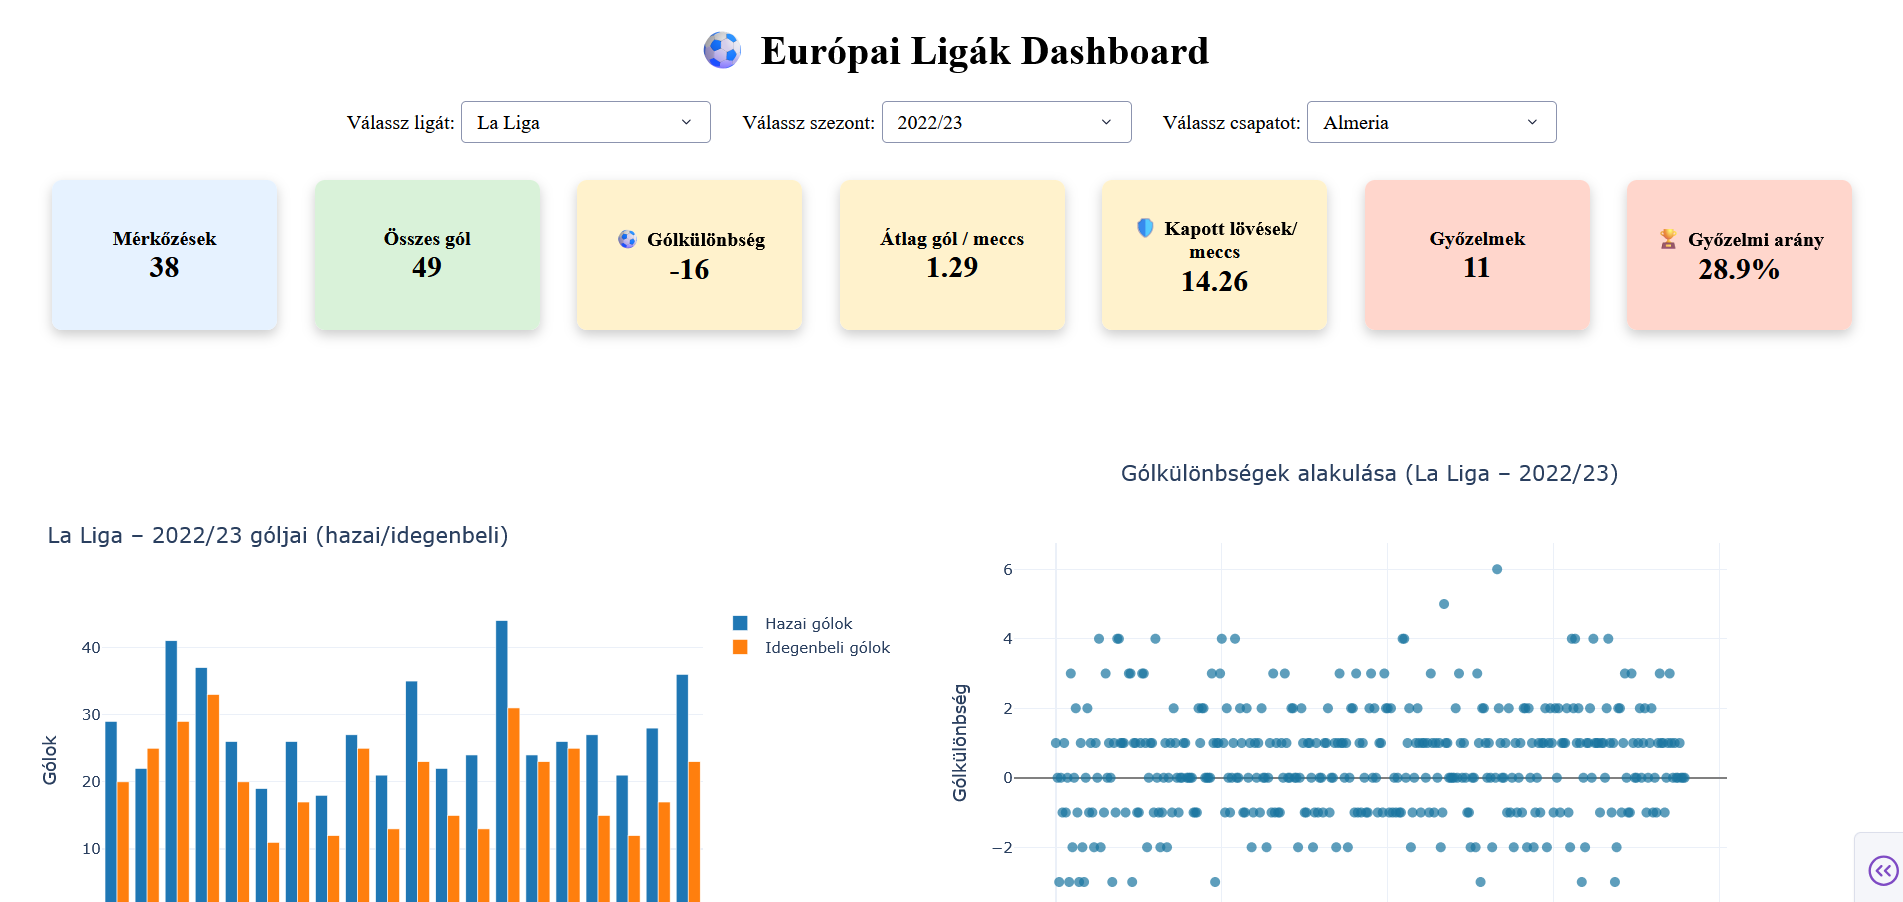
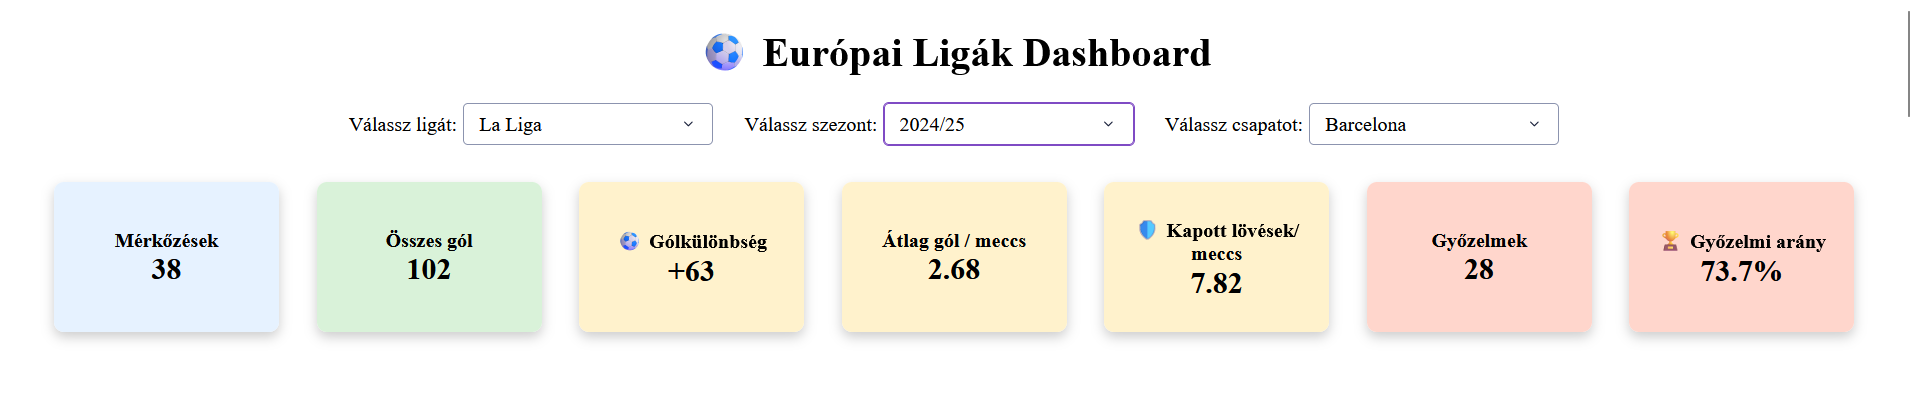
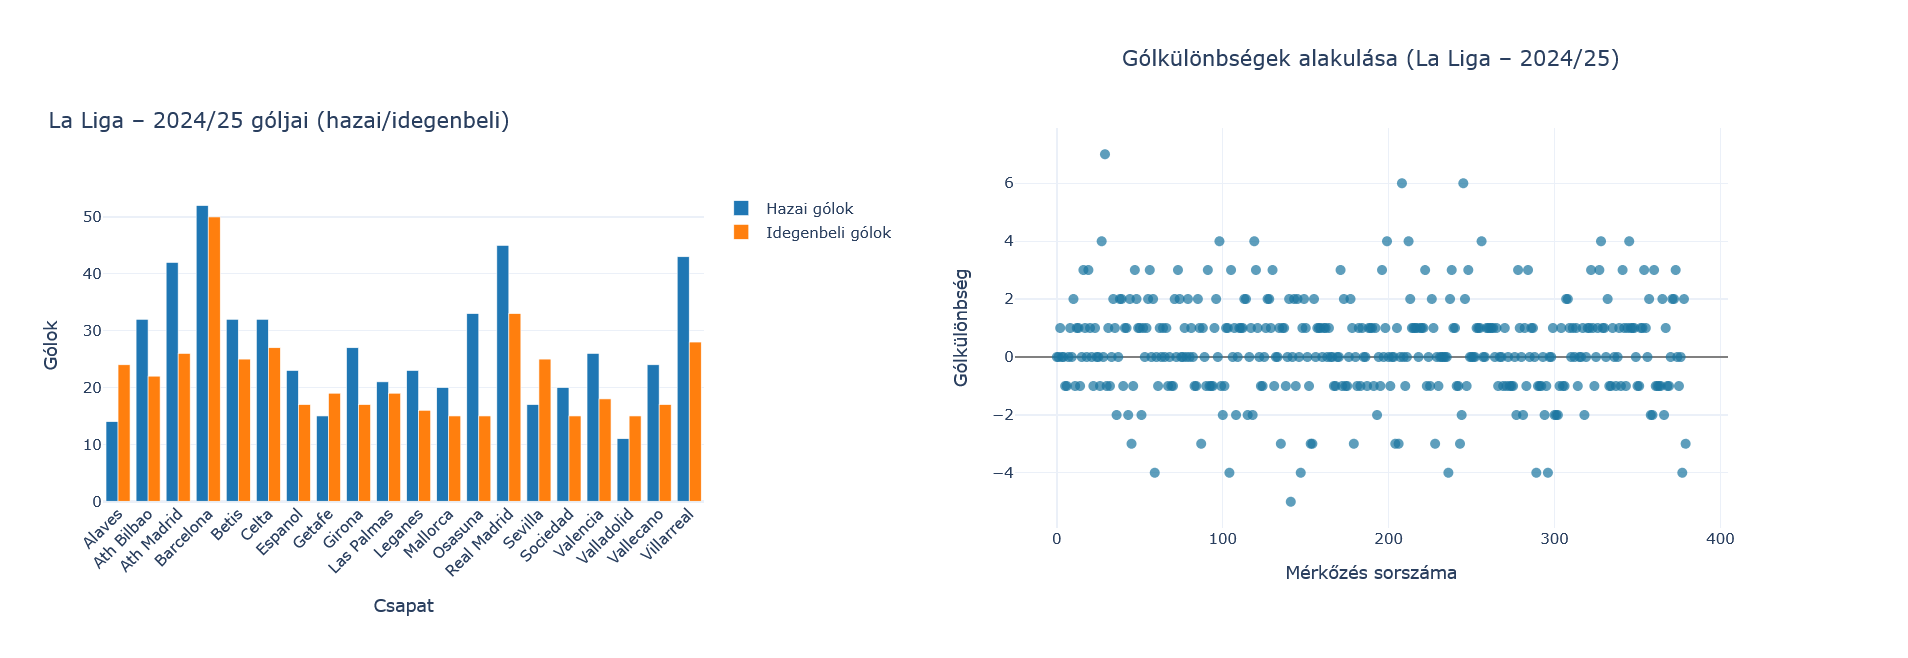
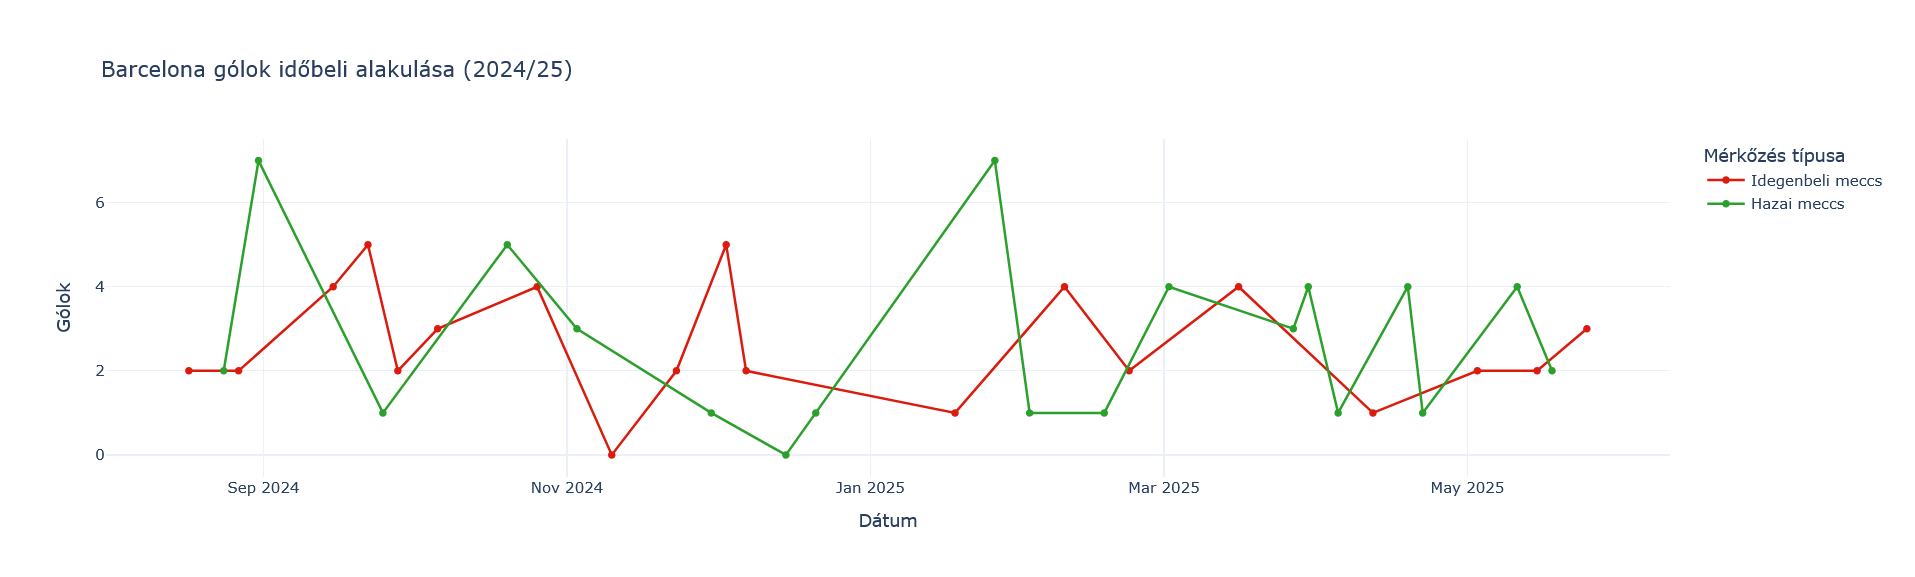
European Football Analytics Dashboard
This Plotly Dash-powered dashboard implements a dual-layer analysis system: processing multi-season match data from top European leagues (PL, La Liga, Serie A, etc.) while managing a database of 15,000+ players for scouting purposes. The system dynamically identifies team form (Best/Worst 3 matches) based on goal differentials and disciplinary metrics, utilizing mirrored visualizations to compare match-level statistics and betting odds (Avg, Pinnacle, Bet365) in real-time.
Key Features
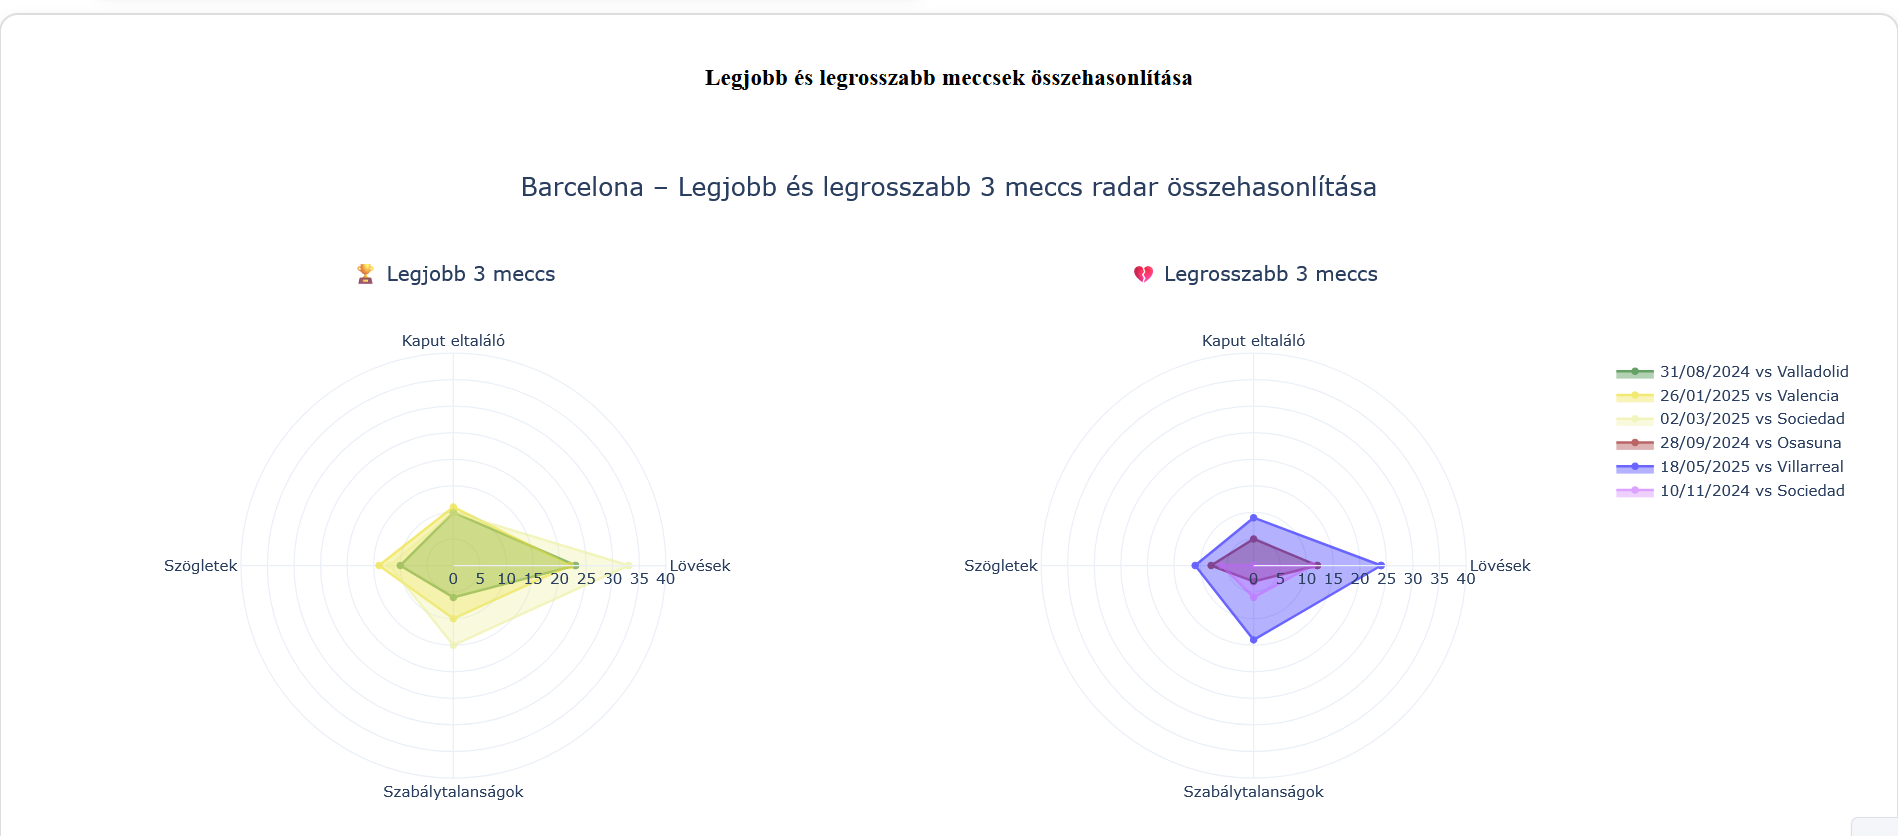
- Dynamic Performance Profiling: Algorithmically identifies 'Best vs Worst 3' matches, using radar charts to contrast shooting efficiency and corner stats under extreme performance scenarios.
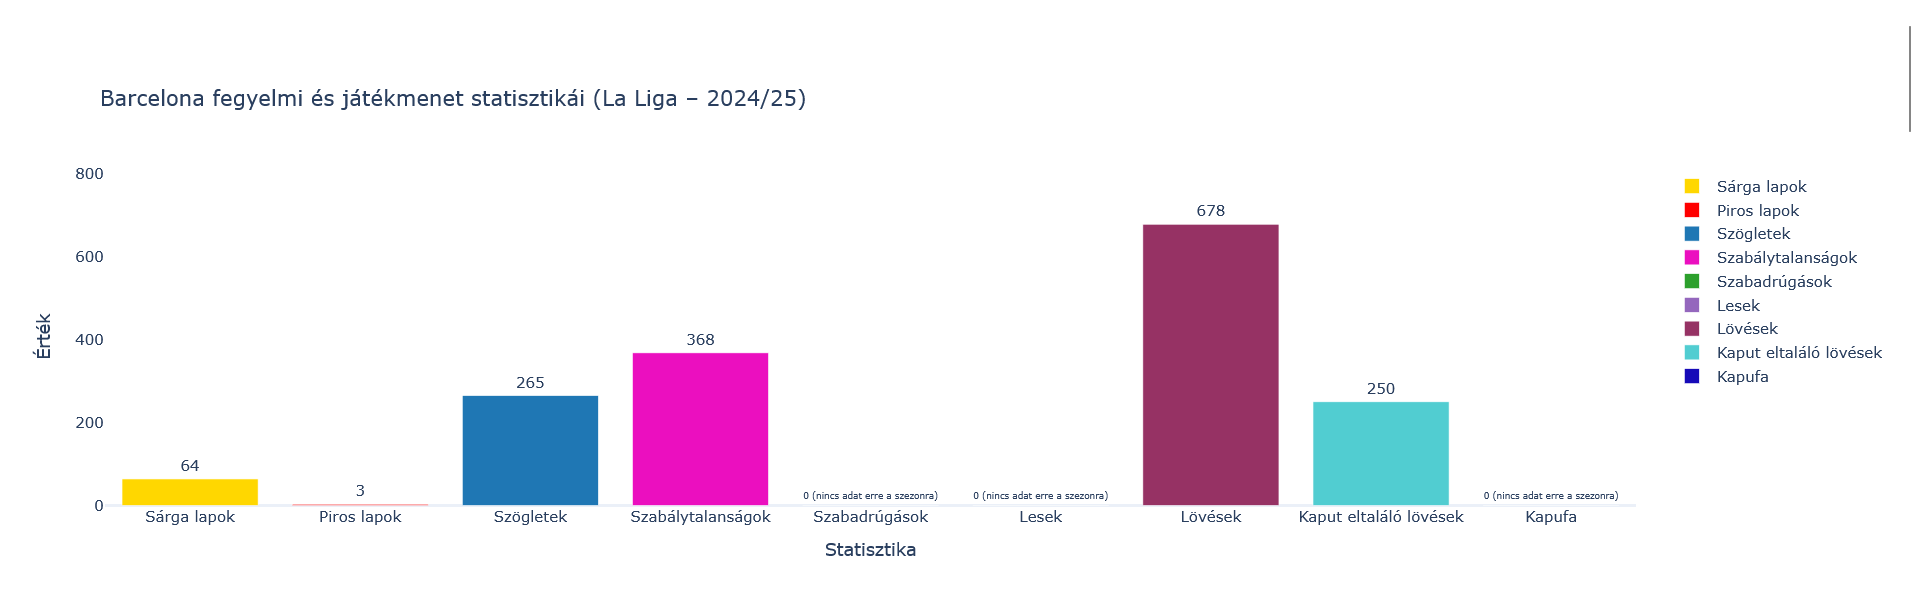
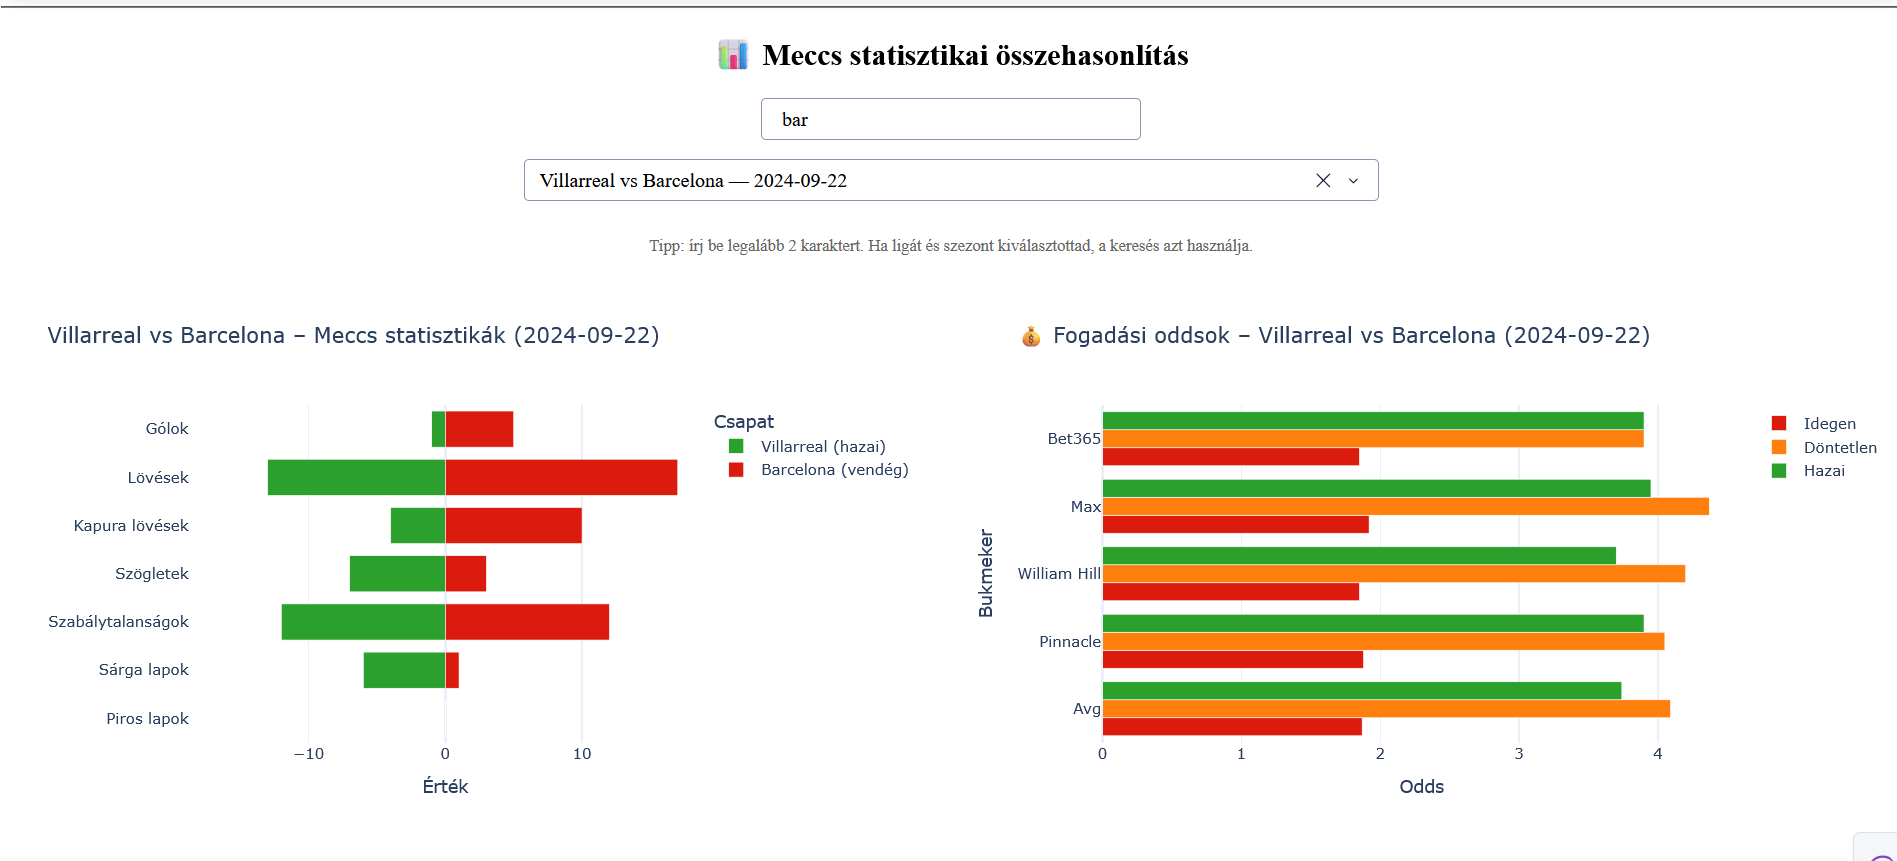
- Mirrored Match Analytics: Custom horizontal mirror-chart implementation for instantaneous visual comparison of Home vs Away statistics (shots, fouls, cards).
- Multi-Source Odds Aggregator: Integrated betting module displaying data from 7+ bookmakers (Pinnacle, William Hill, Bet365, etc.) via grouped bar charts to analyze market fluctuations.
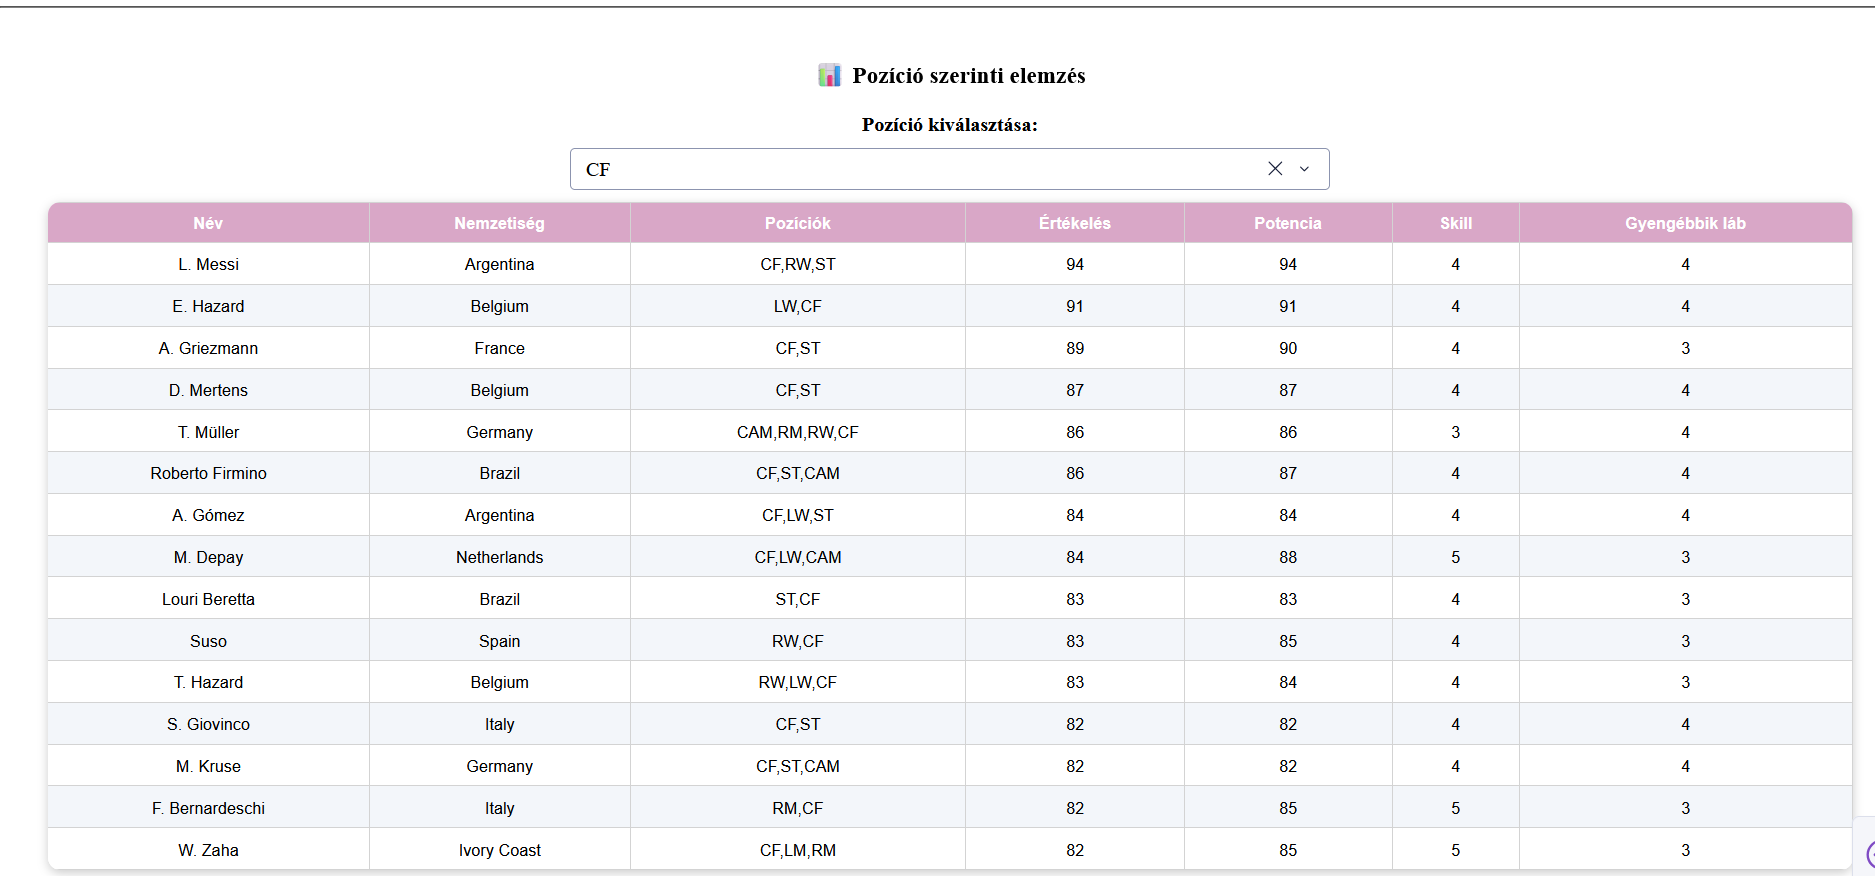
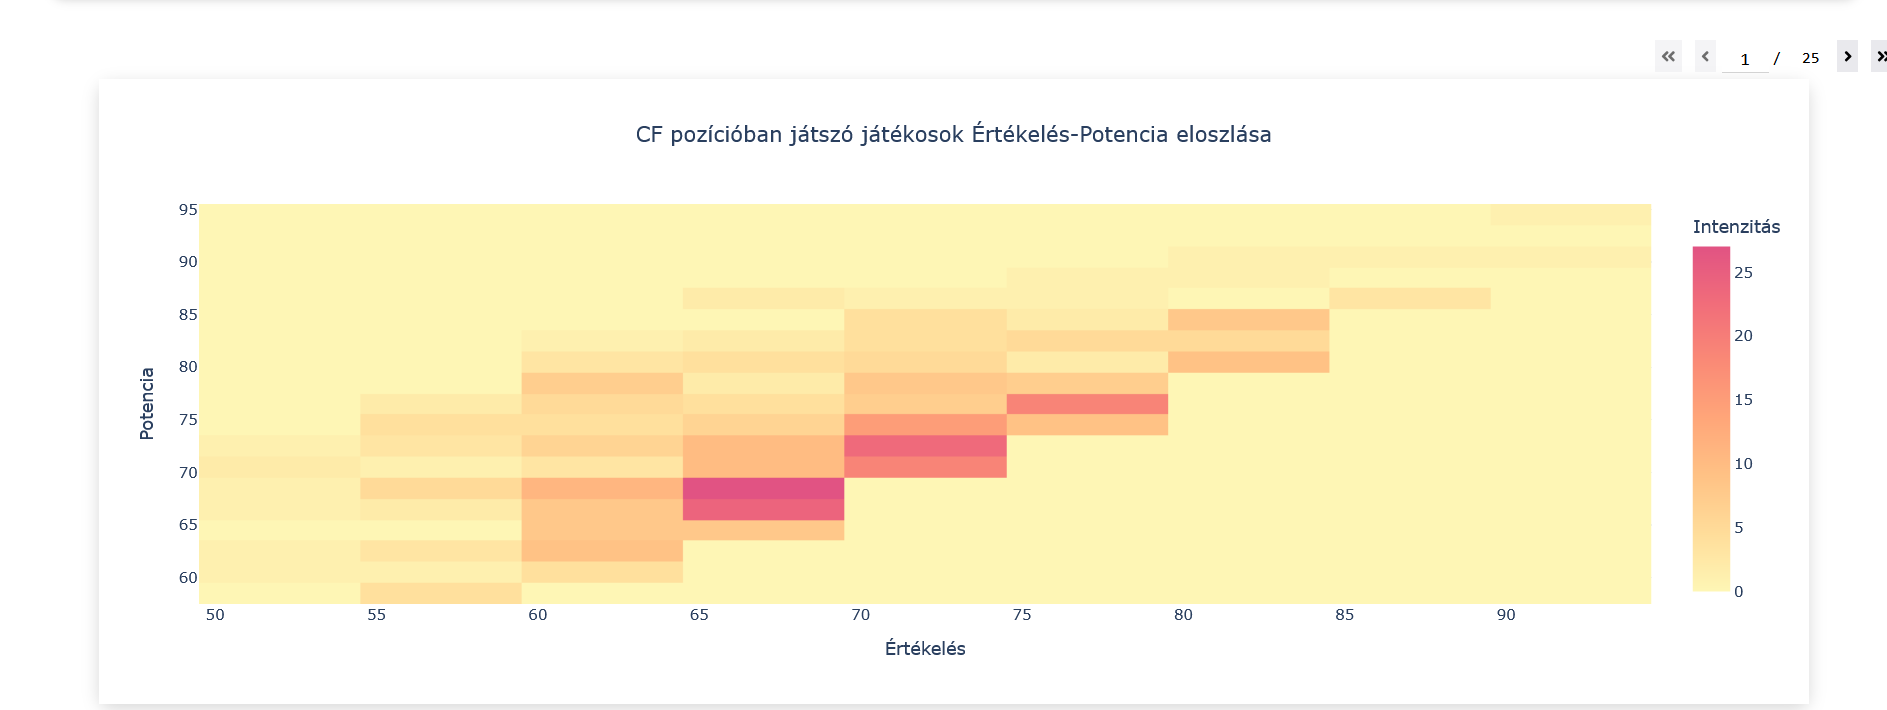
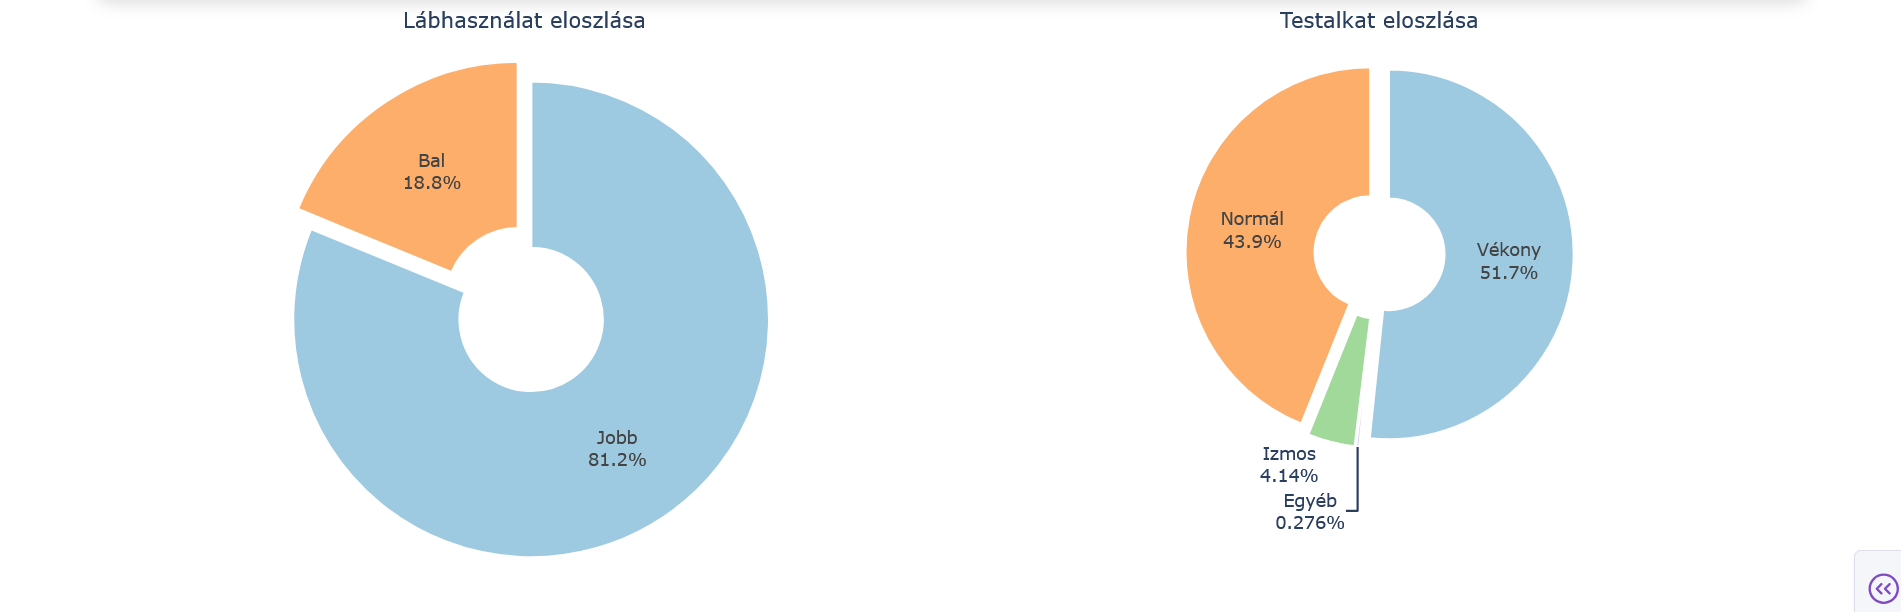
- Position-Based Scouting: Advanced filtering by player position, featuring Rating-Potential correlation heatmaps and physical attribute distribution analysis (Preferred Foot, Body Type).
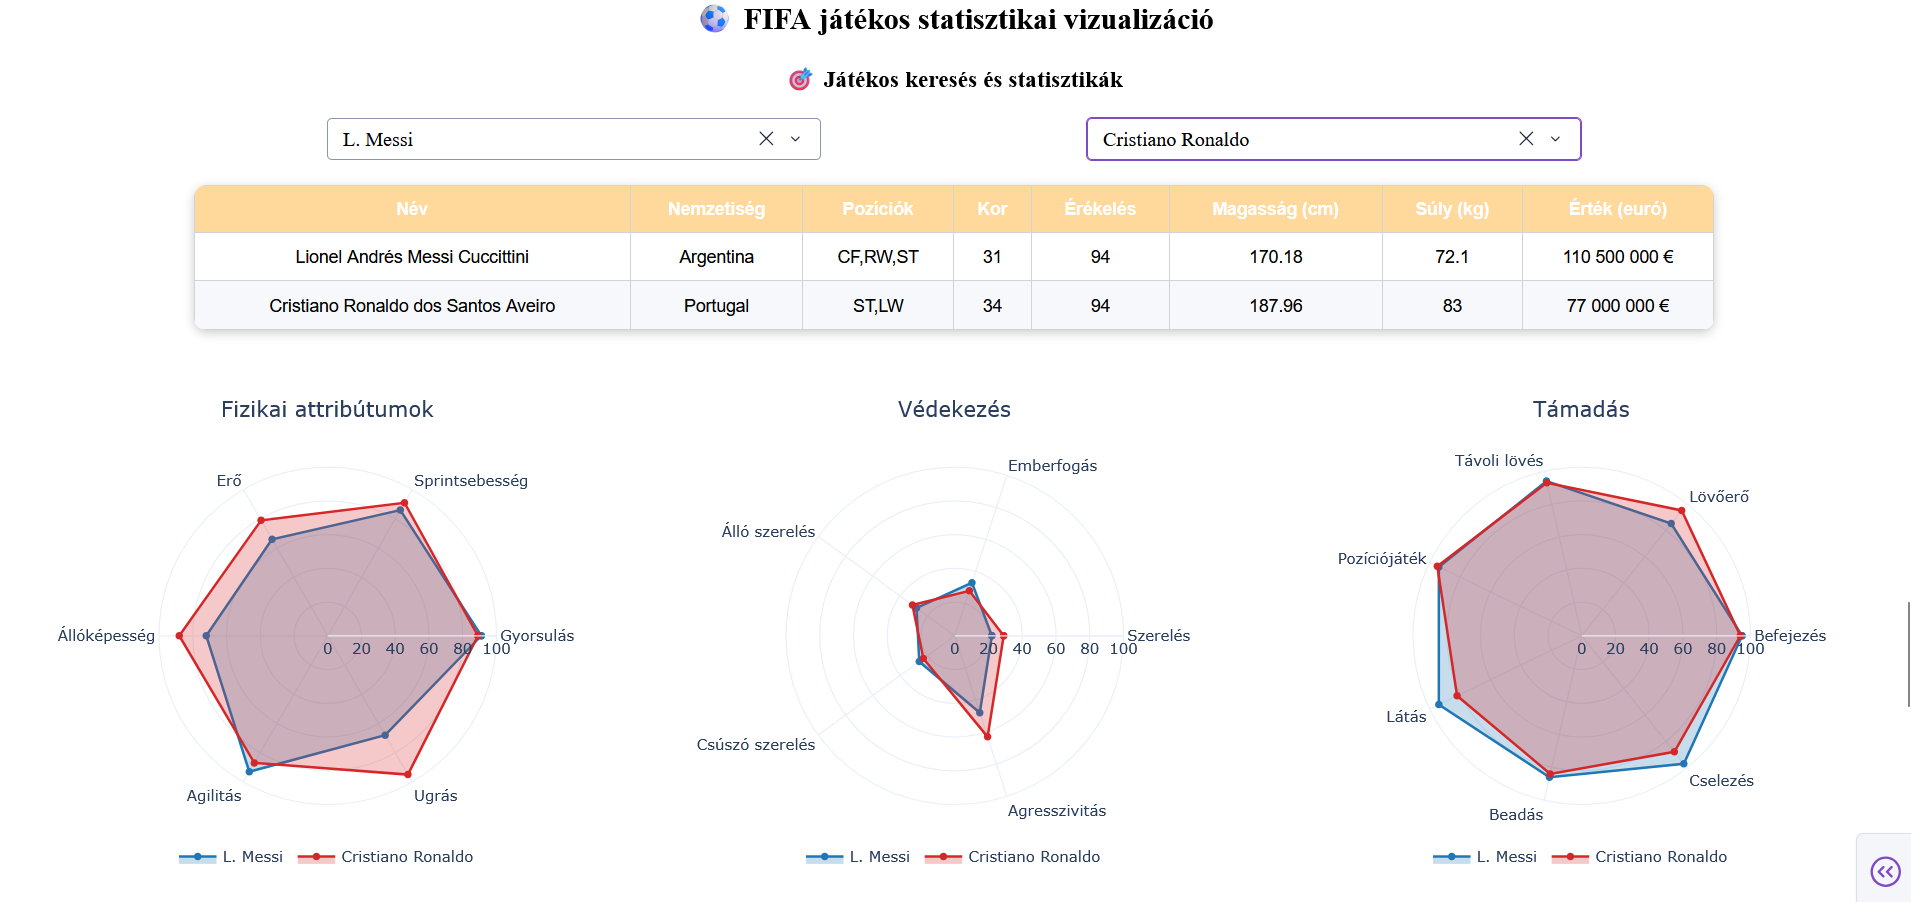
- Multi-Axial Player Comparison: A three-tier radar system (Physical, Offensive, Defensive) for benchmarking players across 20+ distinct attributes in a side-by-side view.
- Smart Data Filtering: Custom callback logic utilizing '|||' delimited metadata to ensure high-speed search and retrieval across thousands of matches, leagues, and seasons.
Tech Stack
PythonPlotly Dash (Reactive Callbacks)Pandas (Data Wrangling & Transformation)Plotly Graph Objects (Polar Charts, Subplots)Plotly Express (Heatmaps, Pie Charts)HTML/CSS (Custom Dashboard Layout)
Screenshots